Intelligence Tab — Reading and Navigating Reports
At a glance
| Topic | Details |
|---|---|
| Best for | Reading published trend reports, switching between time horizons, and understanding how the report priority system works. |
| Start here | Open TrendTap and click the Intelligence tab. Choose a time horizon to see the corresponding report. |
| Outcome | You can navigate reports by horizon, find trends that matter, and launch designs directly from report sections. |
Open it now
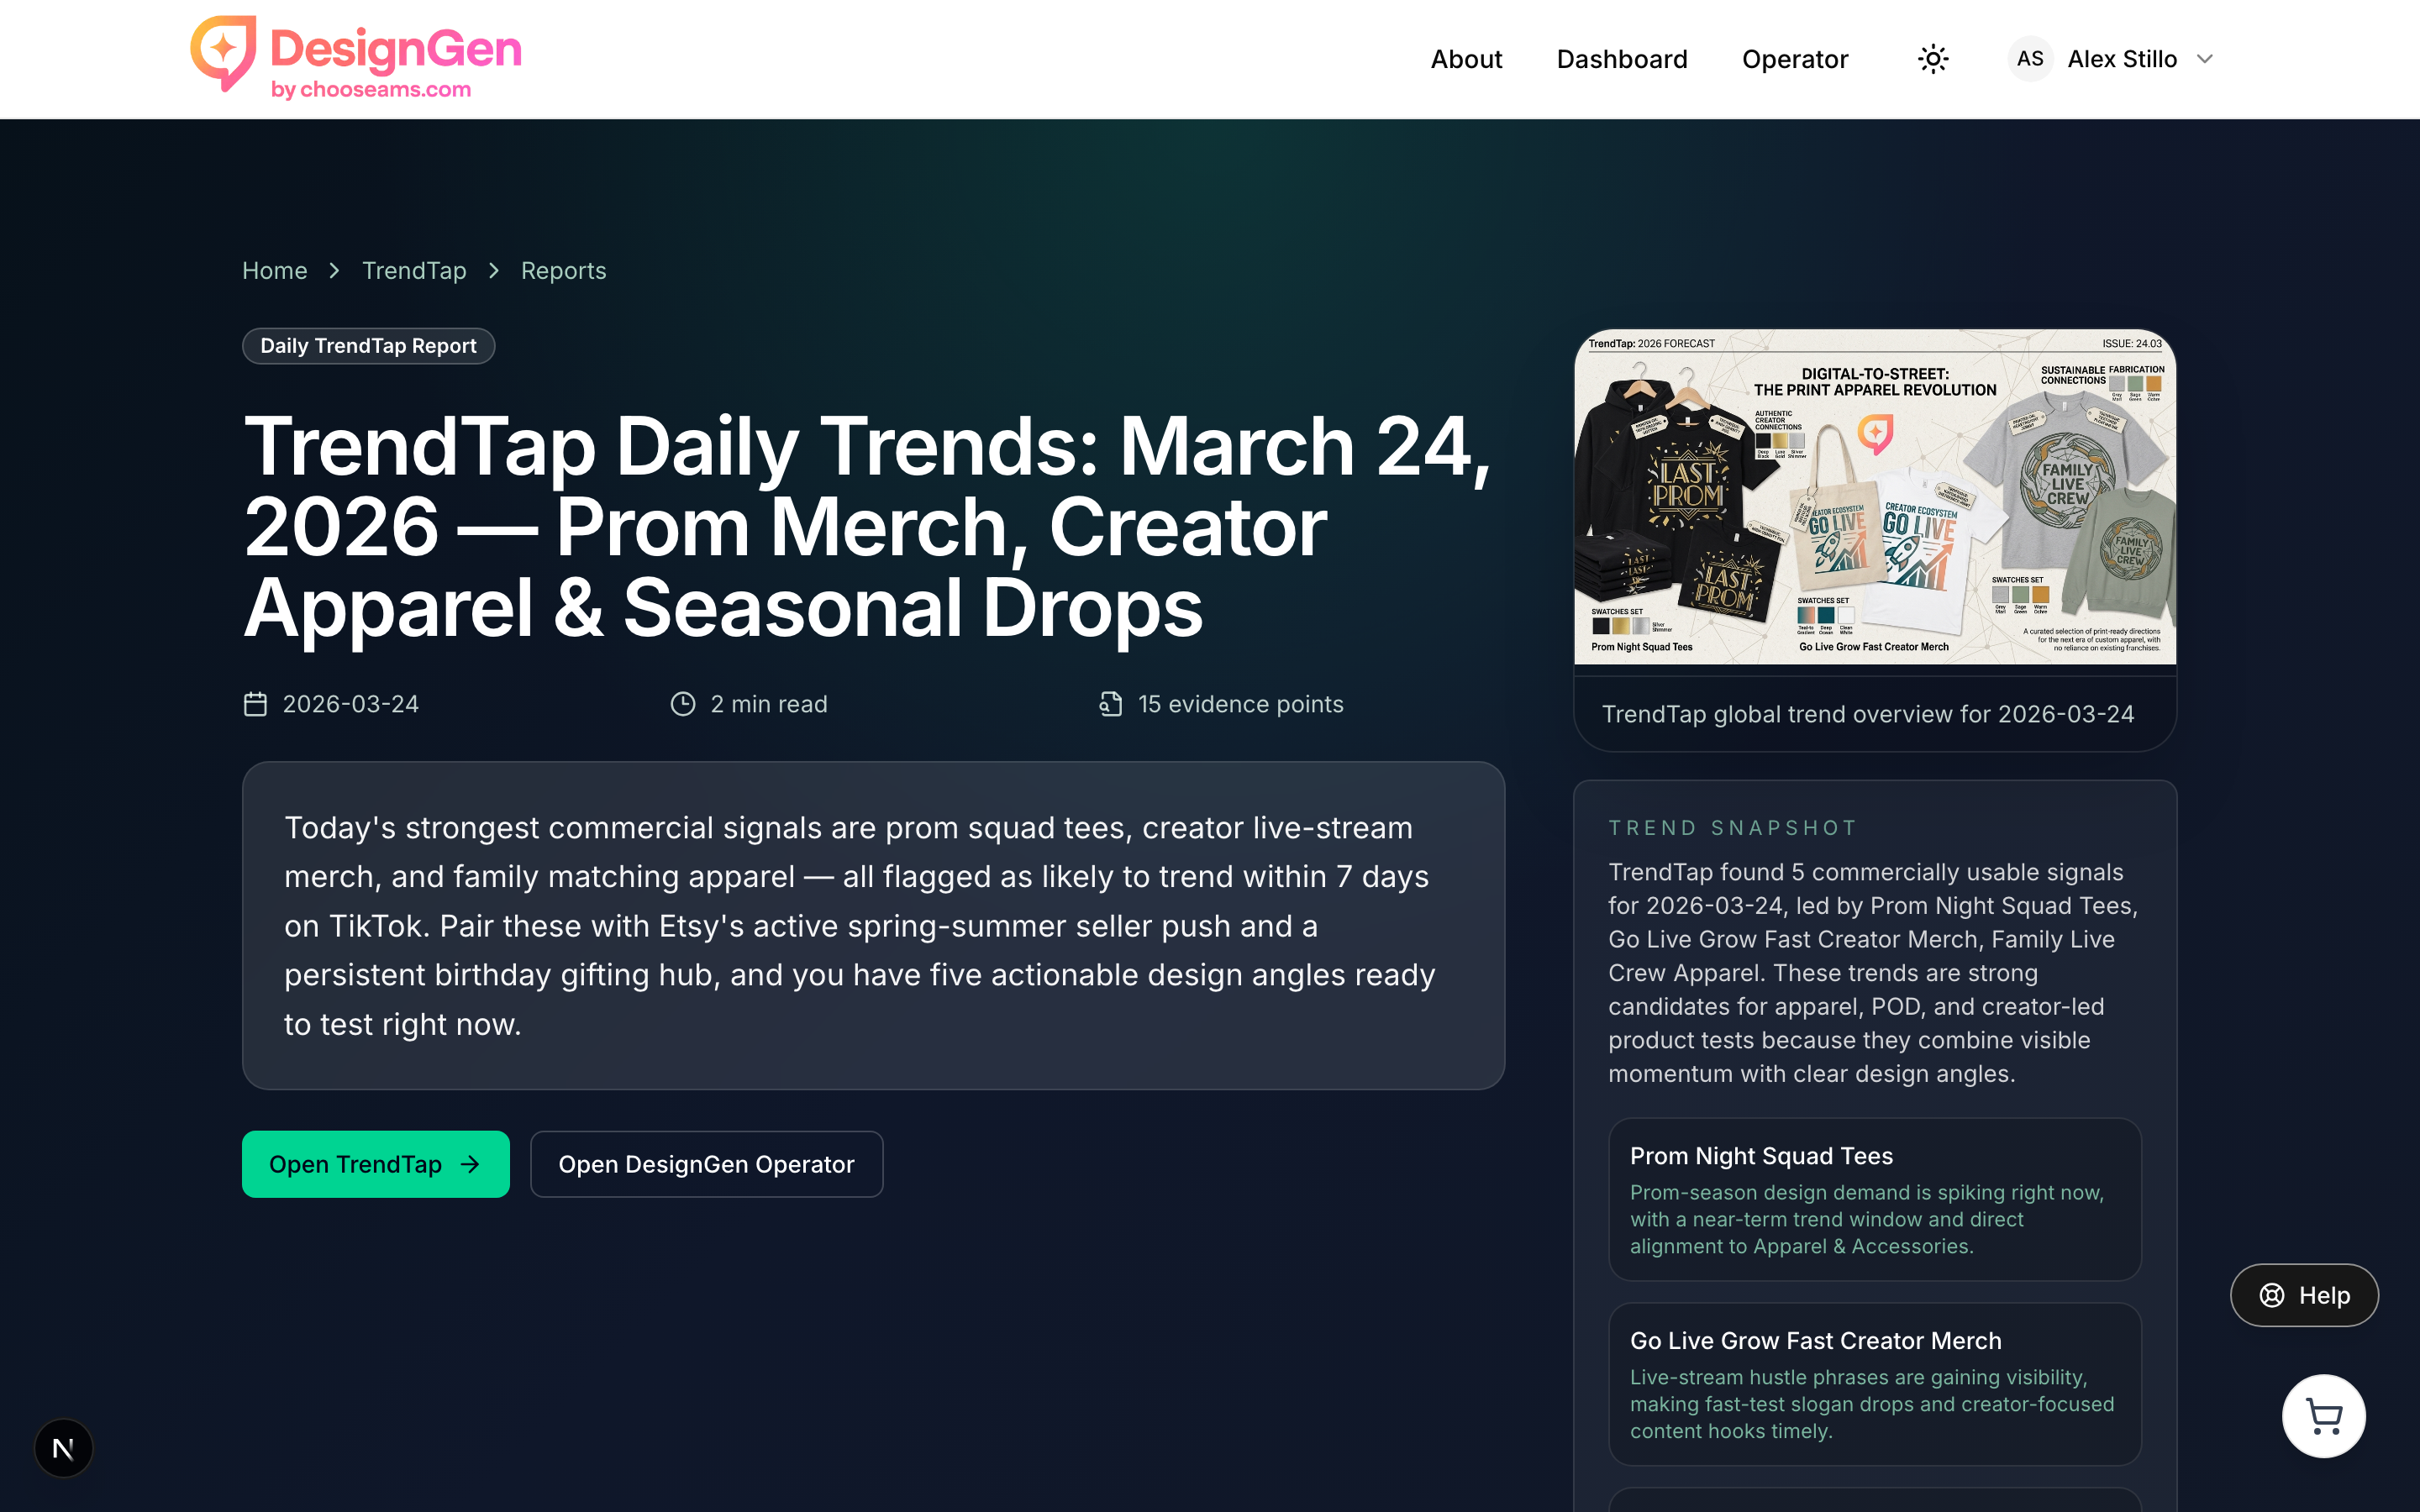
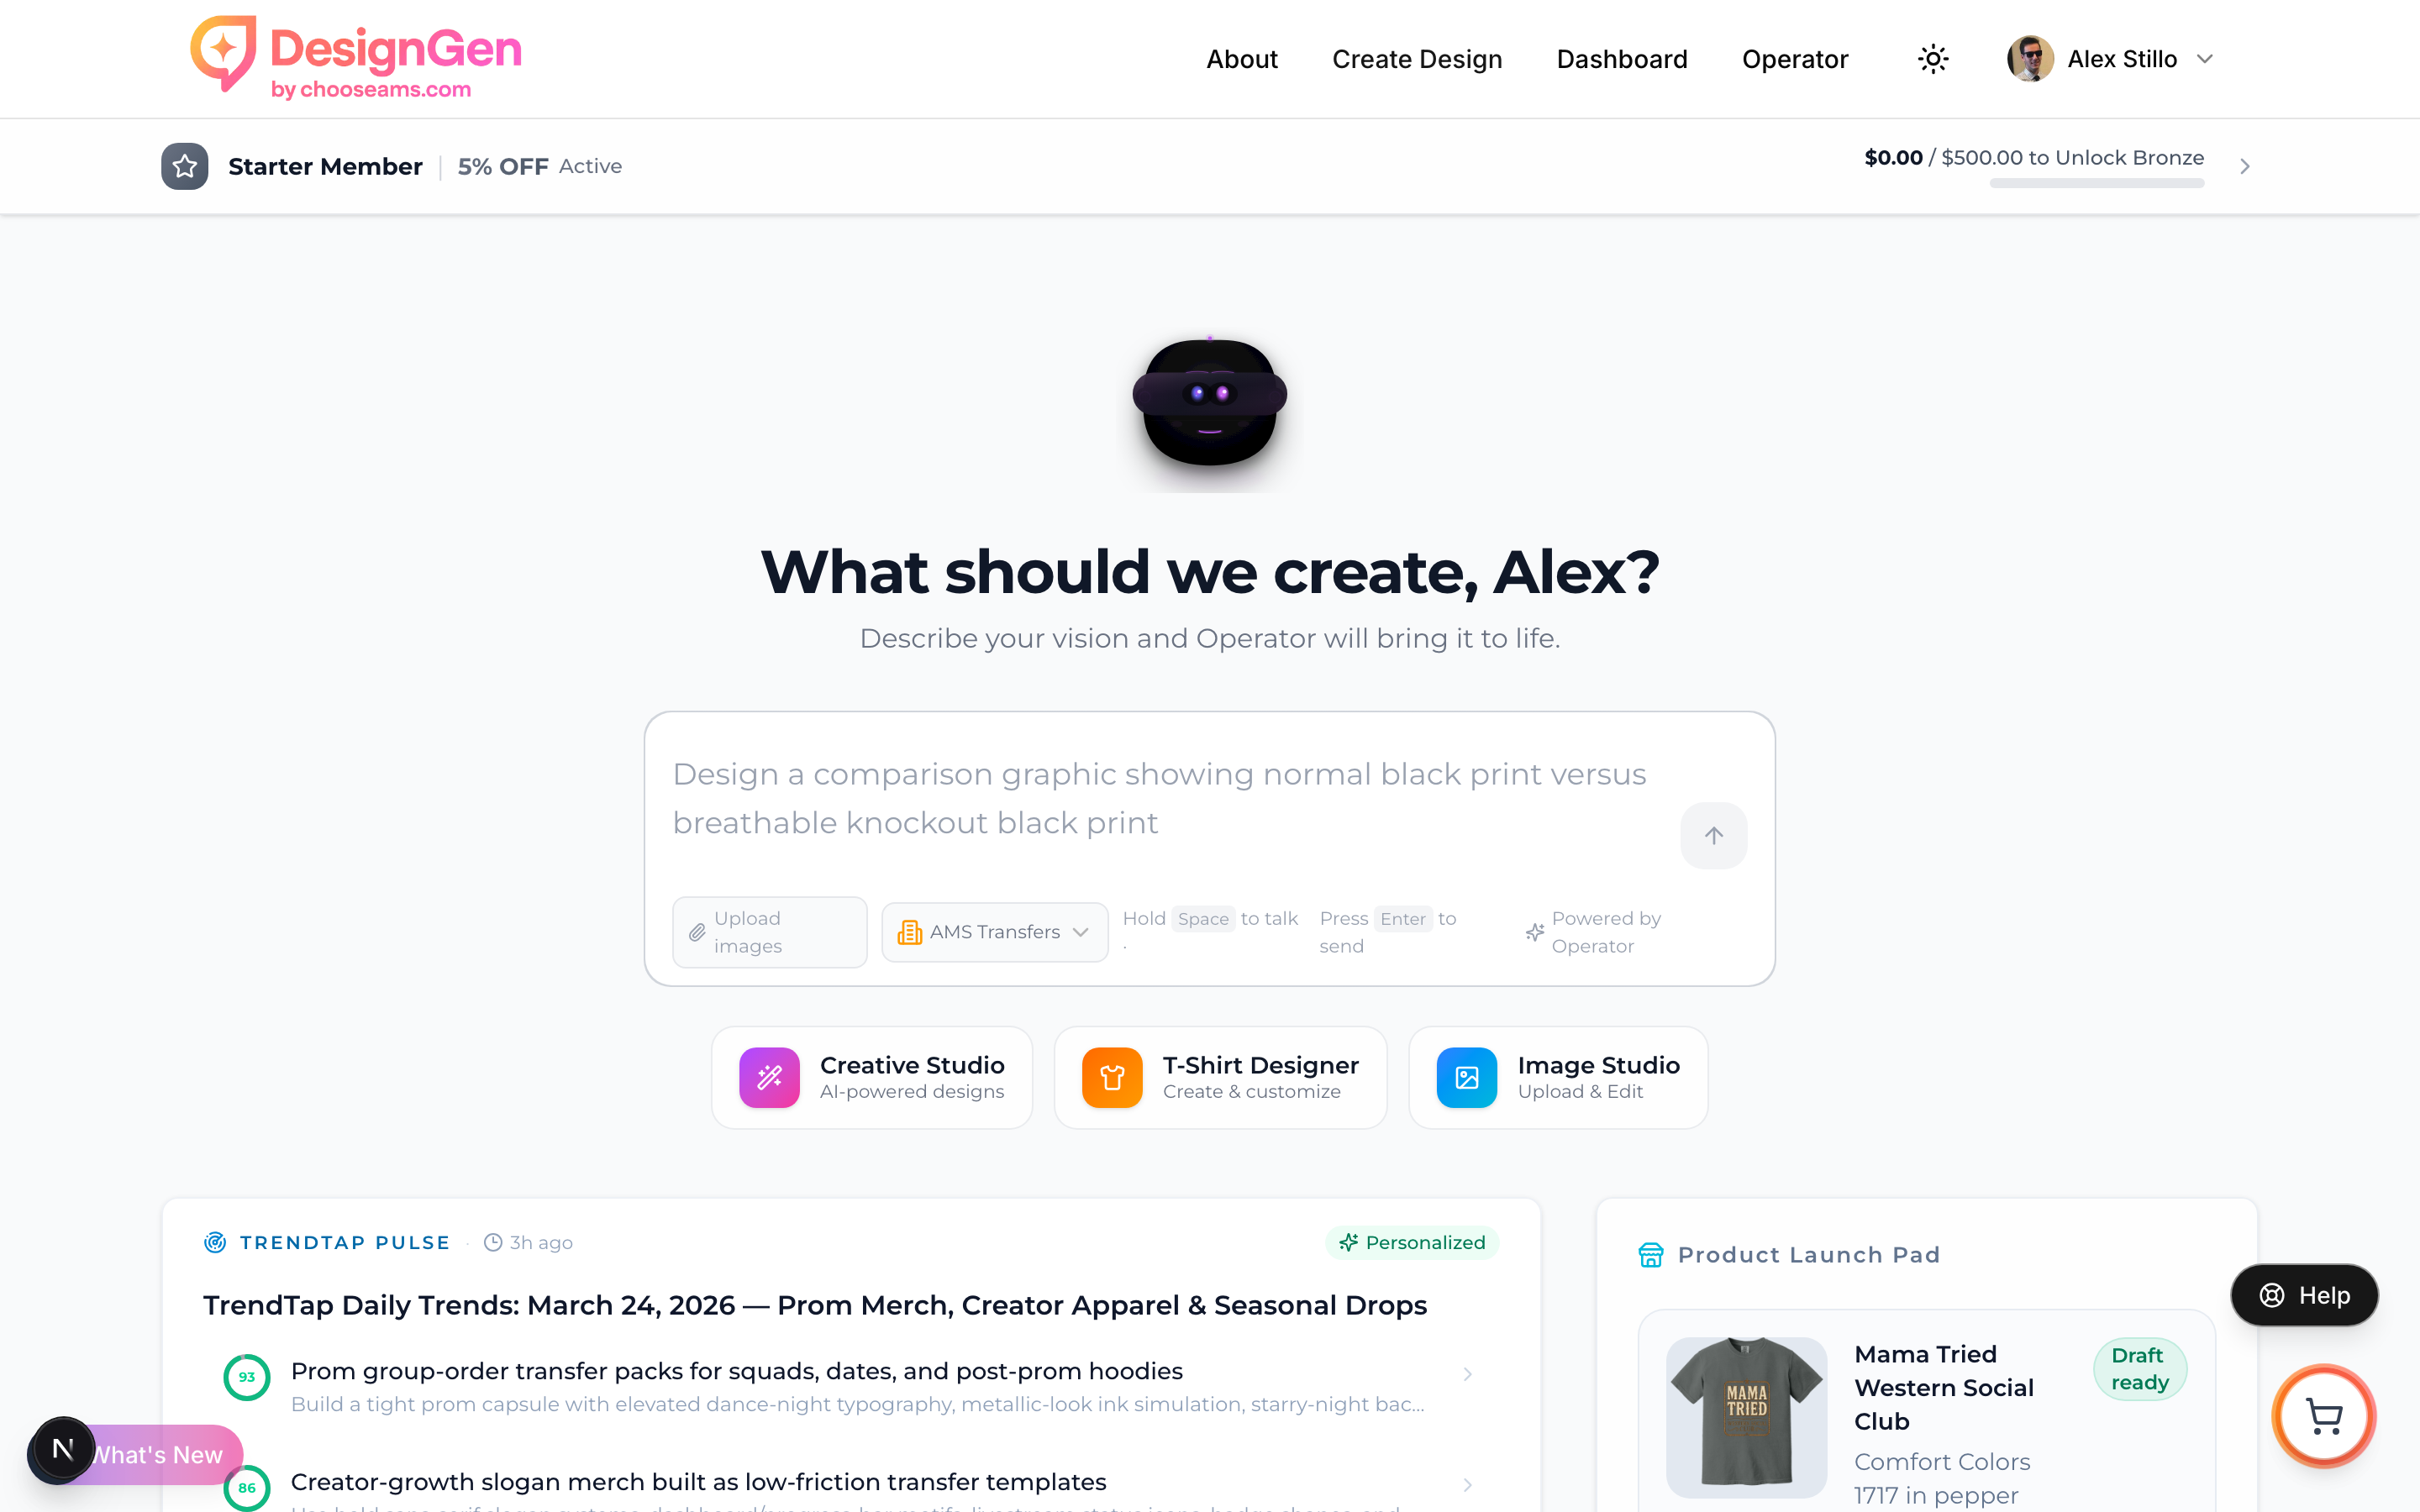
TrendTap publishes full trend reports with rich content, takeaway bullets, and action CTAs. This is the hero section of a daily report.
Before you start
- Reports are available to all users, including free plans. You do not need a Pro subscription to read reports.
- Reports are generated automatically. Monthly reports aggregate the best insights from the month. Weekly reports aggregate the week. Daily reports cover one day.
- When a new report is available, you will see a banner on the Missions tab or a "New" badge on the dashboard card.
The time-horizon selector
At the top of the Intelligence tab, you will see tabs for the available time horizons:
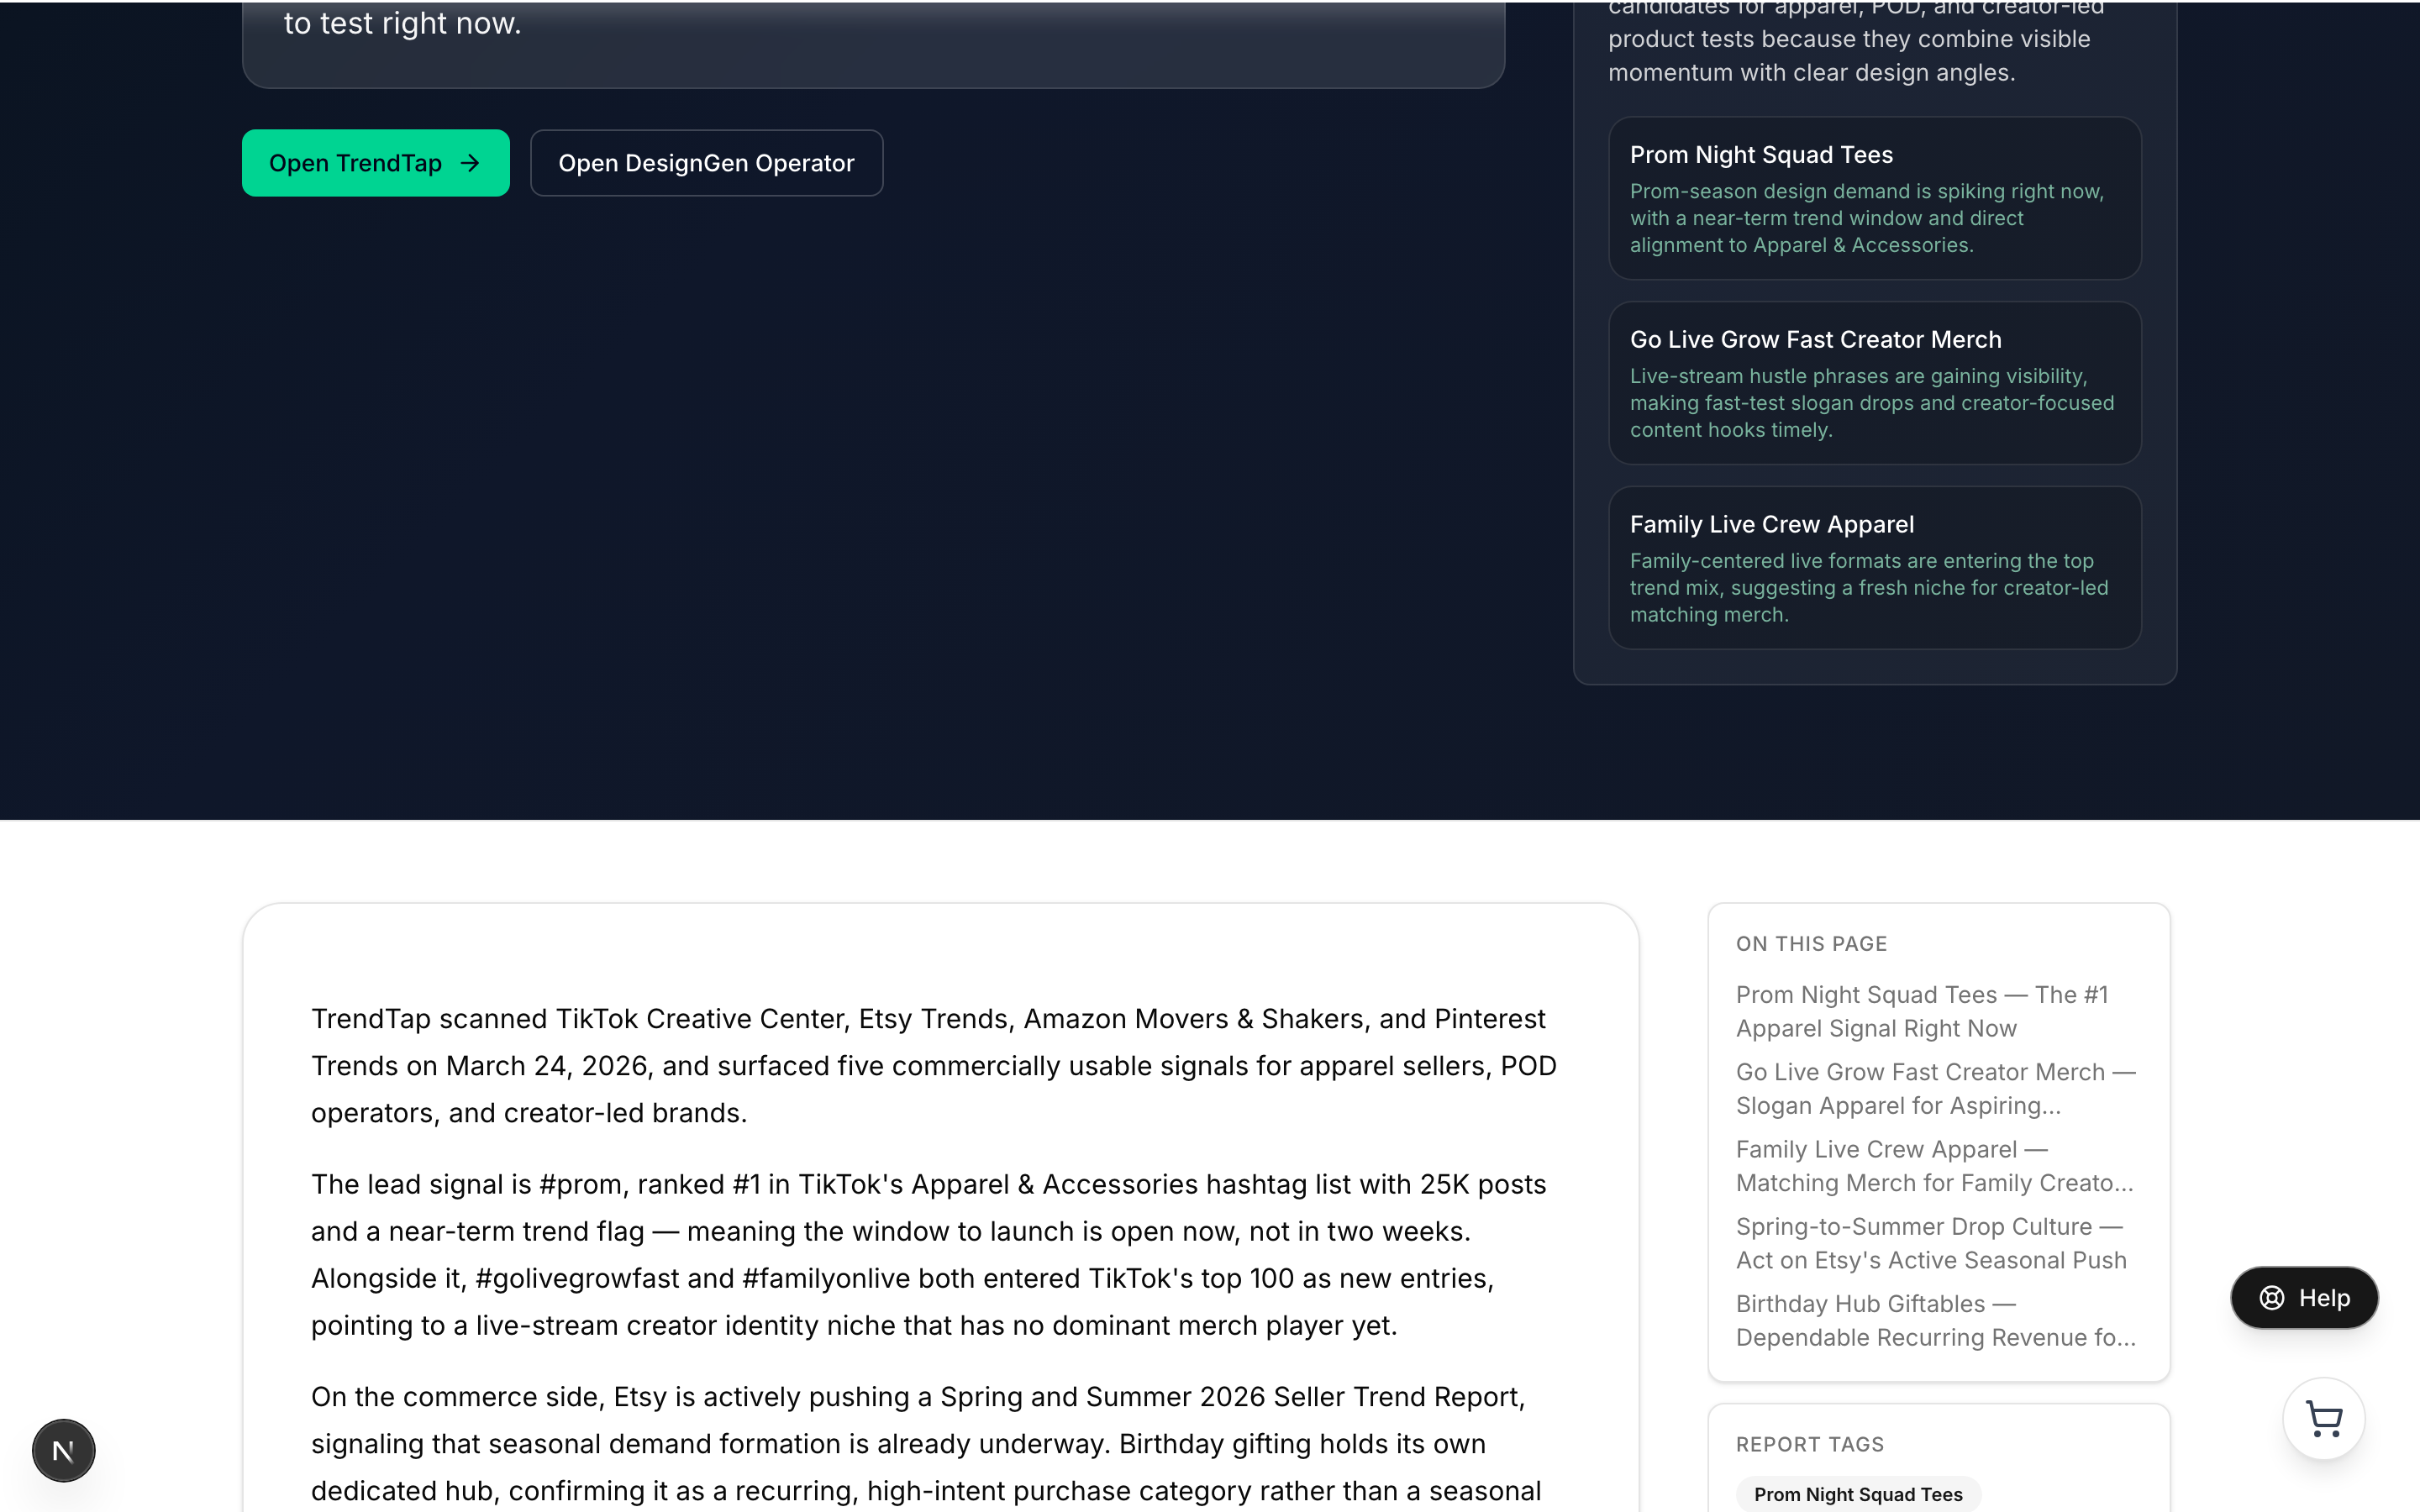
Reports include an "On This Page" sidebar for quick navigation between trend sections. Click any section to jump to it.
- Monthly — A comprehensive roundup of the past month's most important trends. Updated on the 1st of each month.
- Weekly — A focused summary of the past week's emerging trends. Updated every Monday.
- Daily — The most granular view, covering signals from the past 24 hours. Updated every morning.
Report priority: When you open the Intelligence tab, TrendTap defaults to the highest-priority available report: Monthly > Weekly > Daily. This ensures you see the most comprehensive view first.
How reports are structured
Every report follows a consistent structure designed for fast scanning:
- Hero section — Title, date, and a one-paragraph executive summary (the "answer first" approach).
- Introduction — Context for the report's trends and why they matter now.
- Trend sections — Each major trend gets its own section with a heading, summary, detailed markdown analysis, and bullet takeaways.
- Conclusion — A wrap-up with forward-looking perspective.
- FAQ — Common questions about the trends, with concise answers.
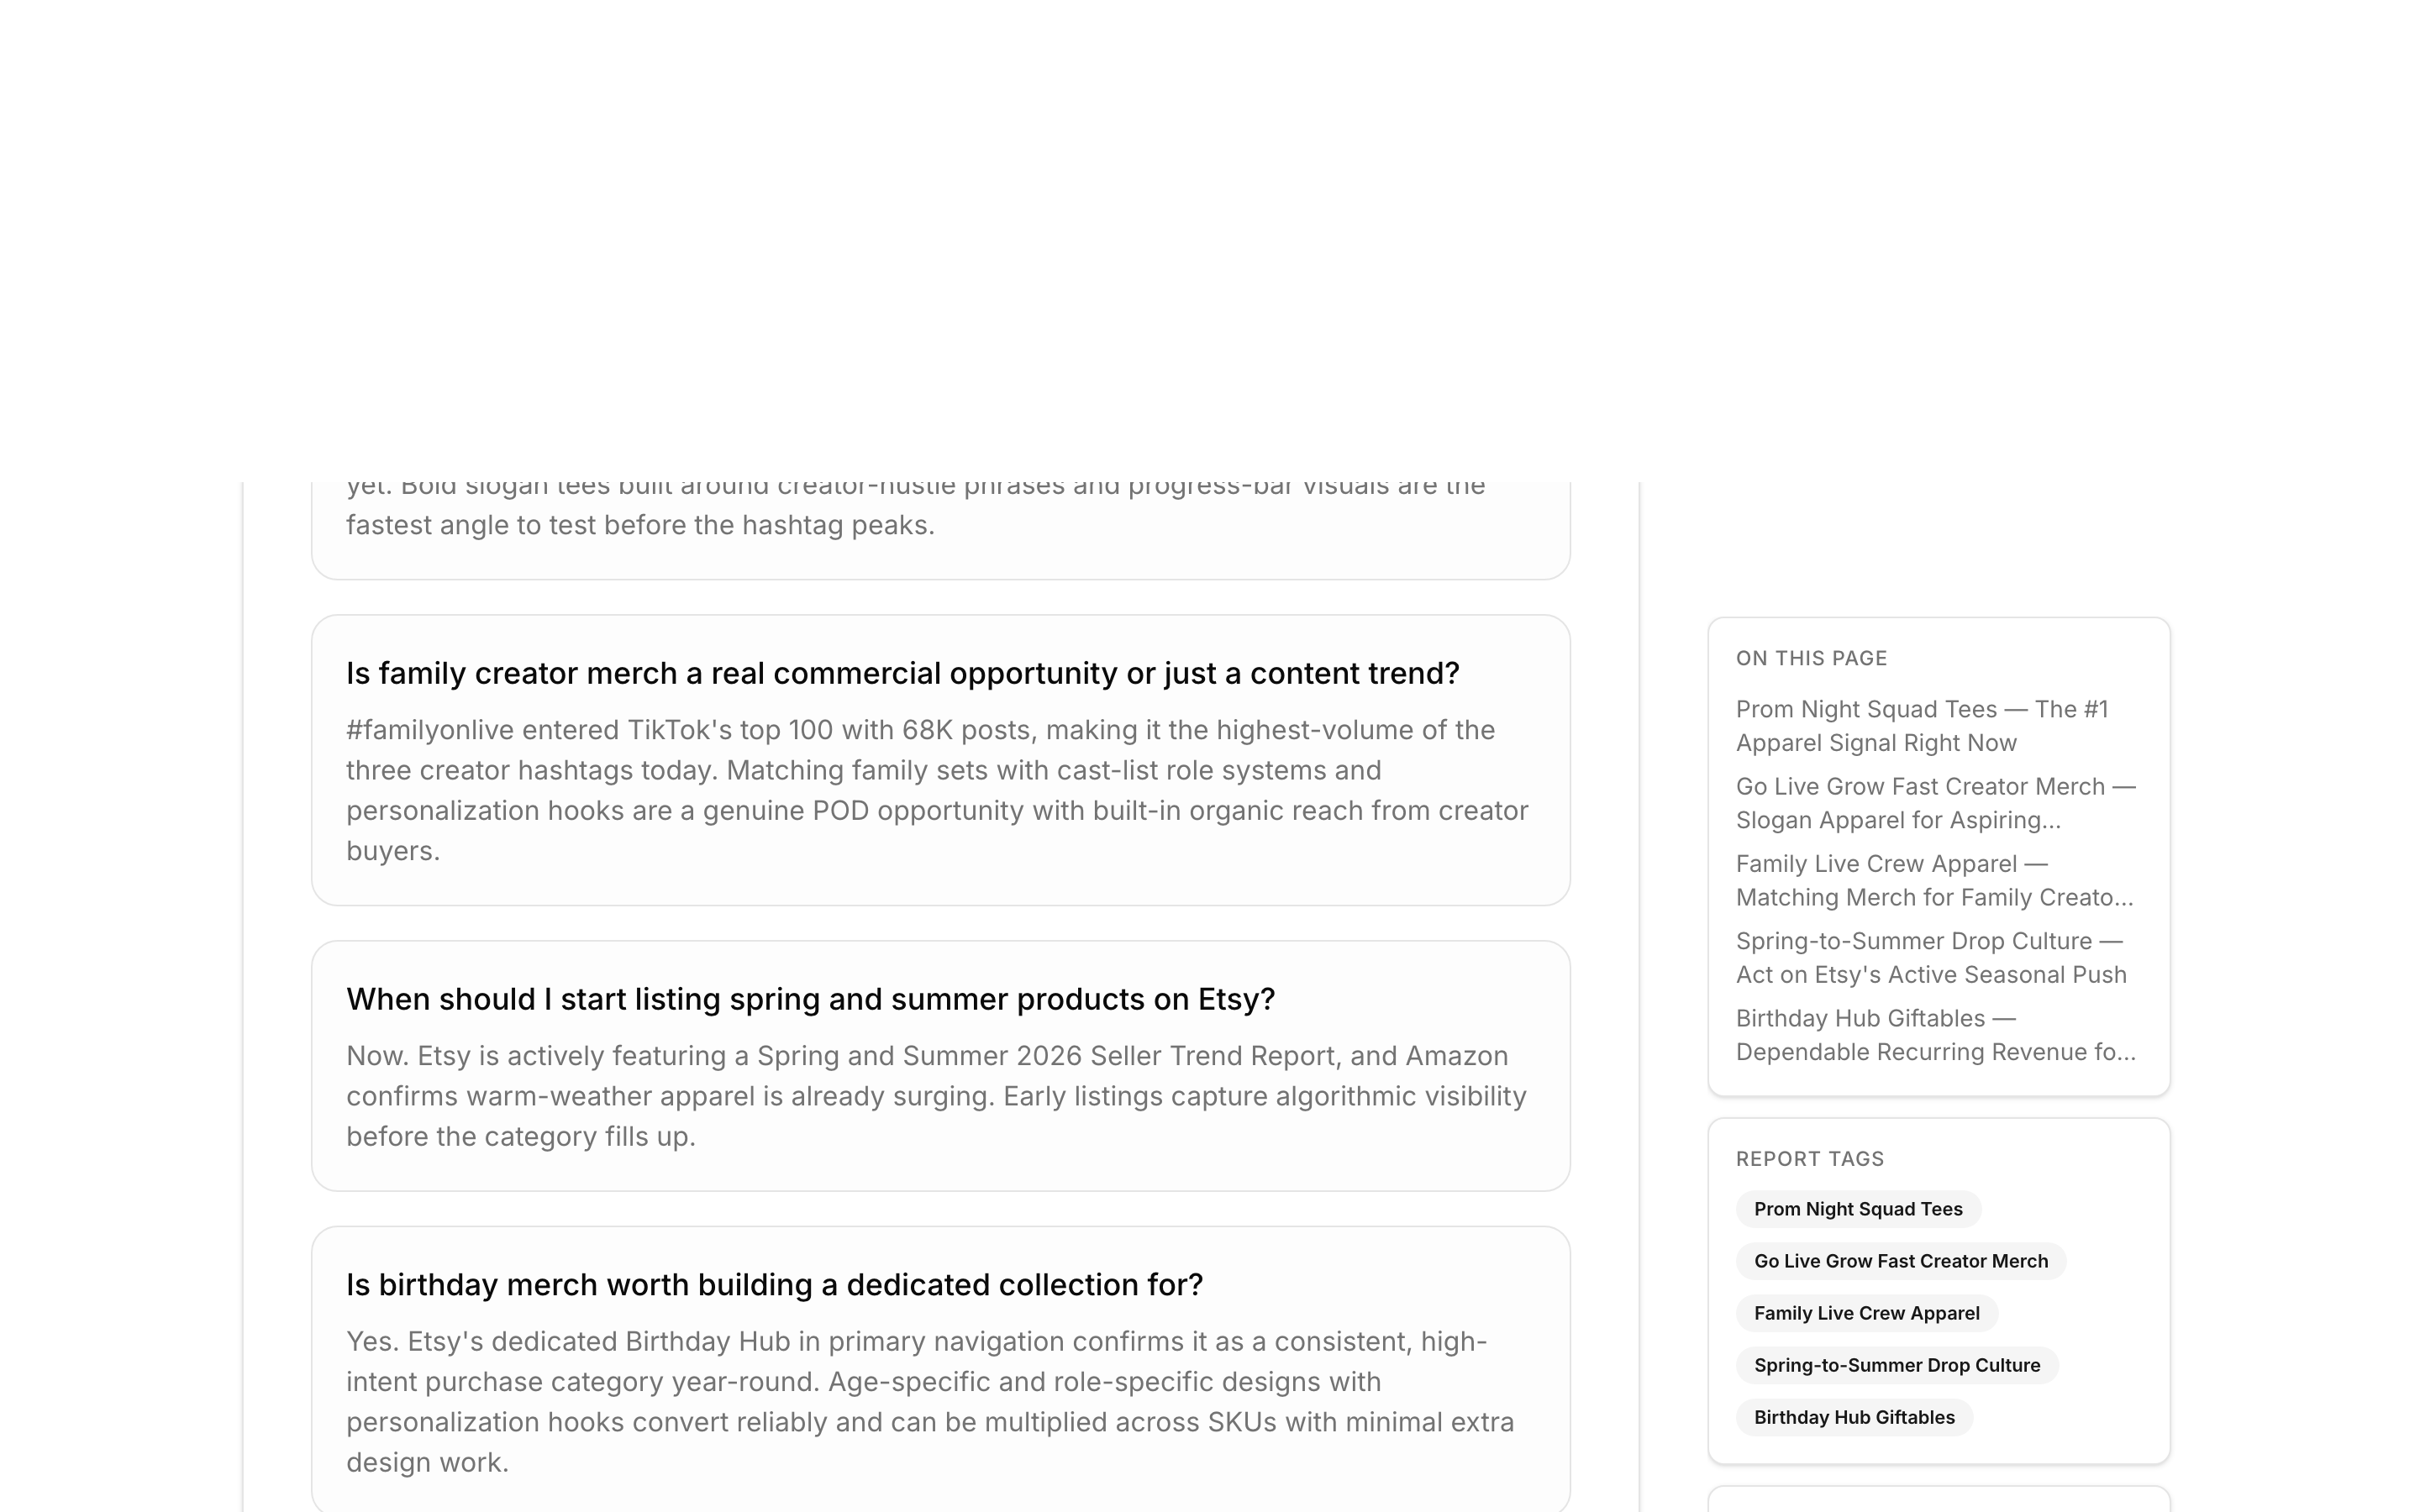
Each report includes detailed trend sections with analysis, and a FAQ answering common questions about the trends covered.
Creating designs from reports
Every report section includes a "Create Design" button. When you click it:
- TrendTap builds a prompt from the trend title and its design angle.
- The prompt is handed off to Operator with full context.
- Operator opens and starts working on a design.
- The report is marked as "acted on" in your read state.
If you are a Pro user, the report sections also show matched opportunities from your personalized brief. Look for the green callout that says "Your angle" with a fit score.
Unread indicators and "New" badges
TrendTap tracks which reports you have read and surfaces unread reports prominently:
- Dashboard card — Shows a "New" badge next to the highest-priority unread report (Monthly > Weekly > Daily).
- Missions tab banner — When an unread report is available, a banner appears at the top: "Your Monthly Trend Report is ready" (amber) or "This Week's Trend Roundup is ready" (green).
- Auto-read — Reports are marked as read 3 seconds after you start viewing them. You do not need to click anything.
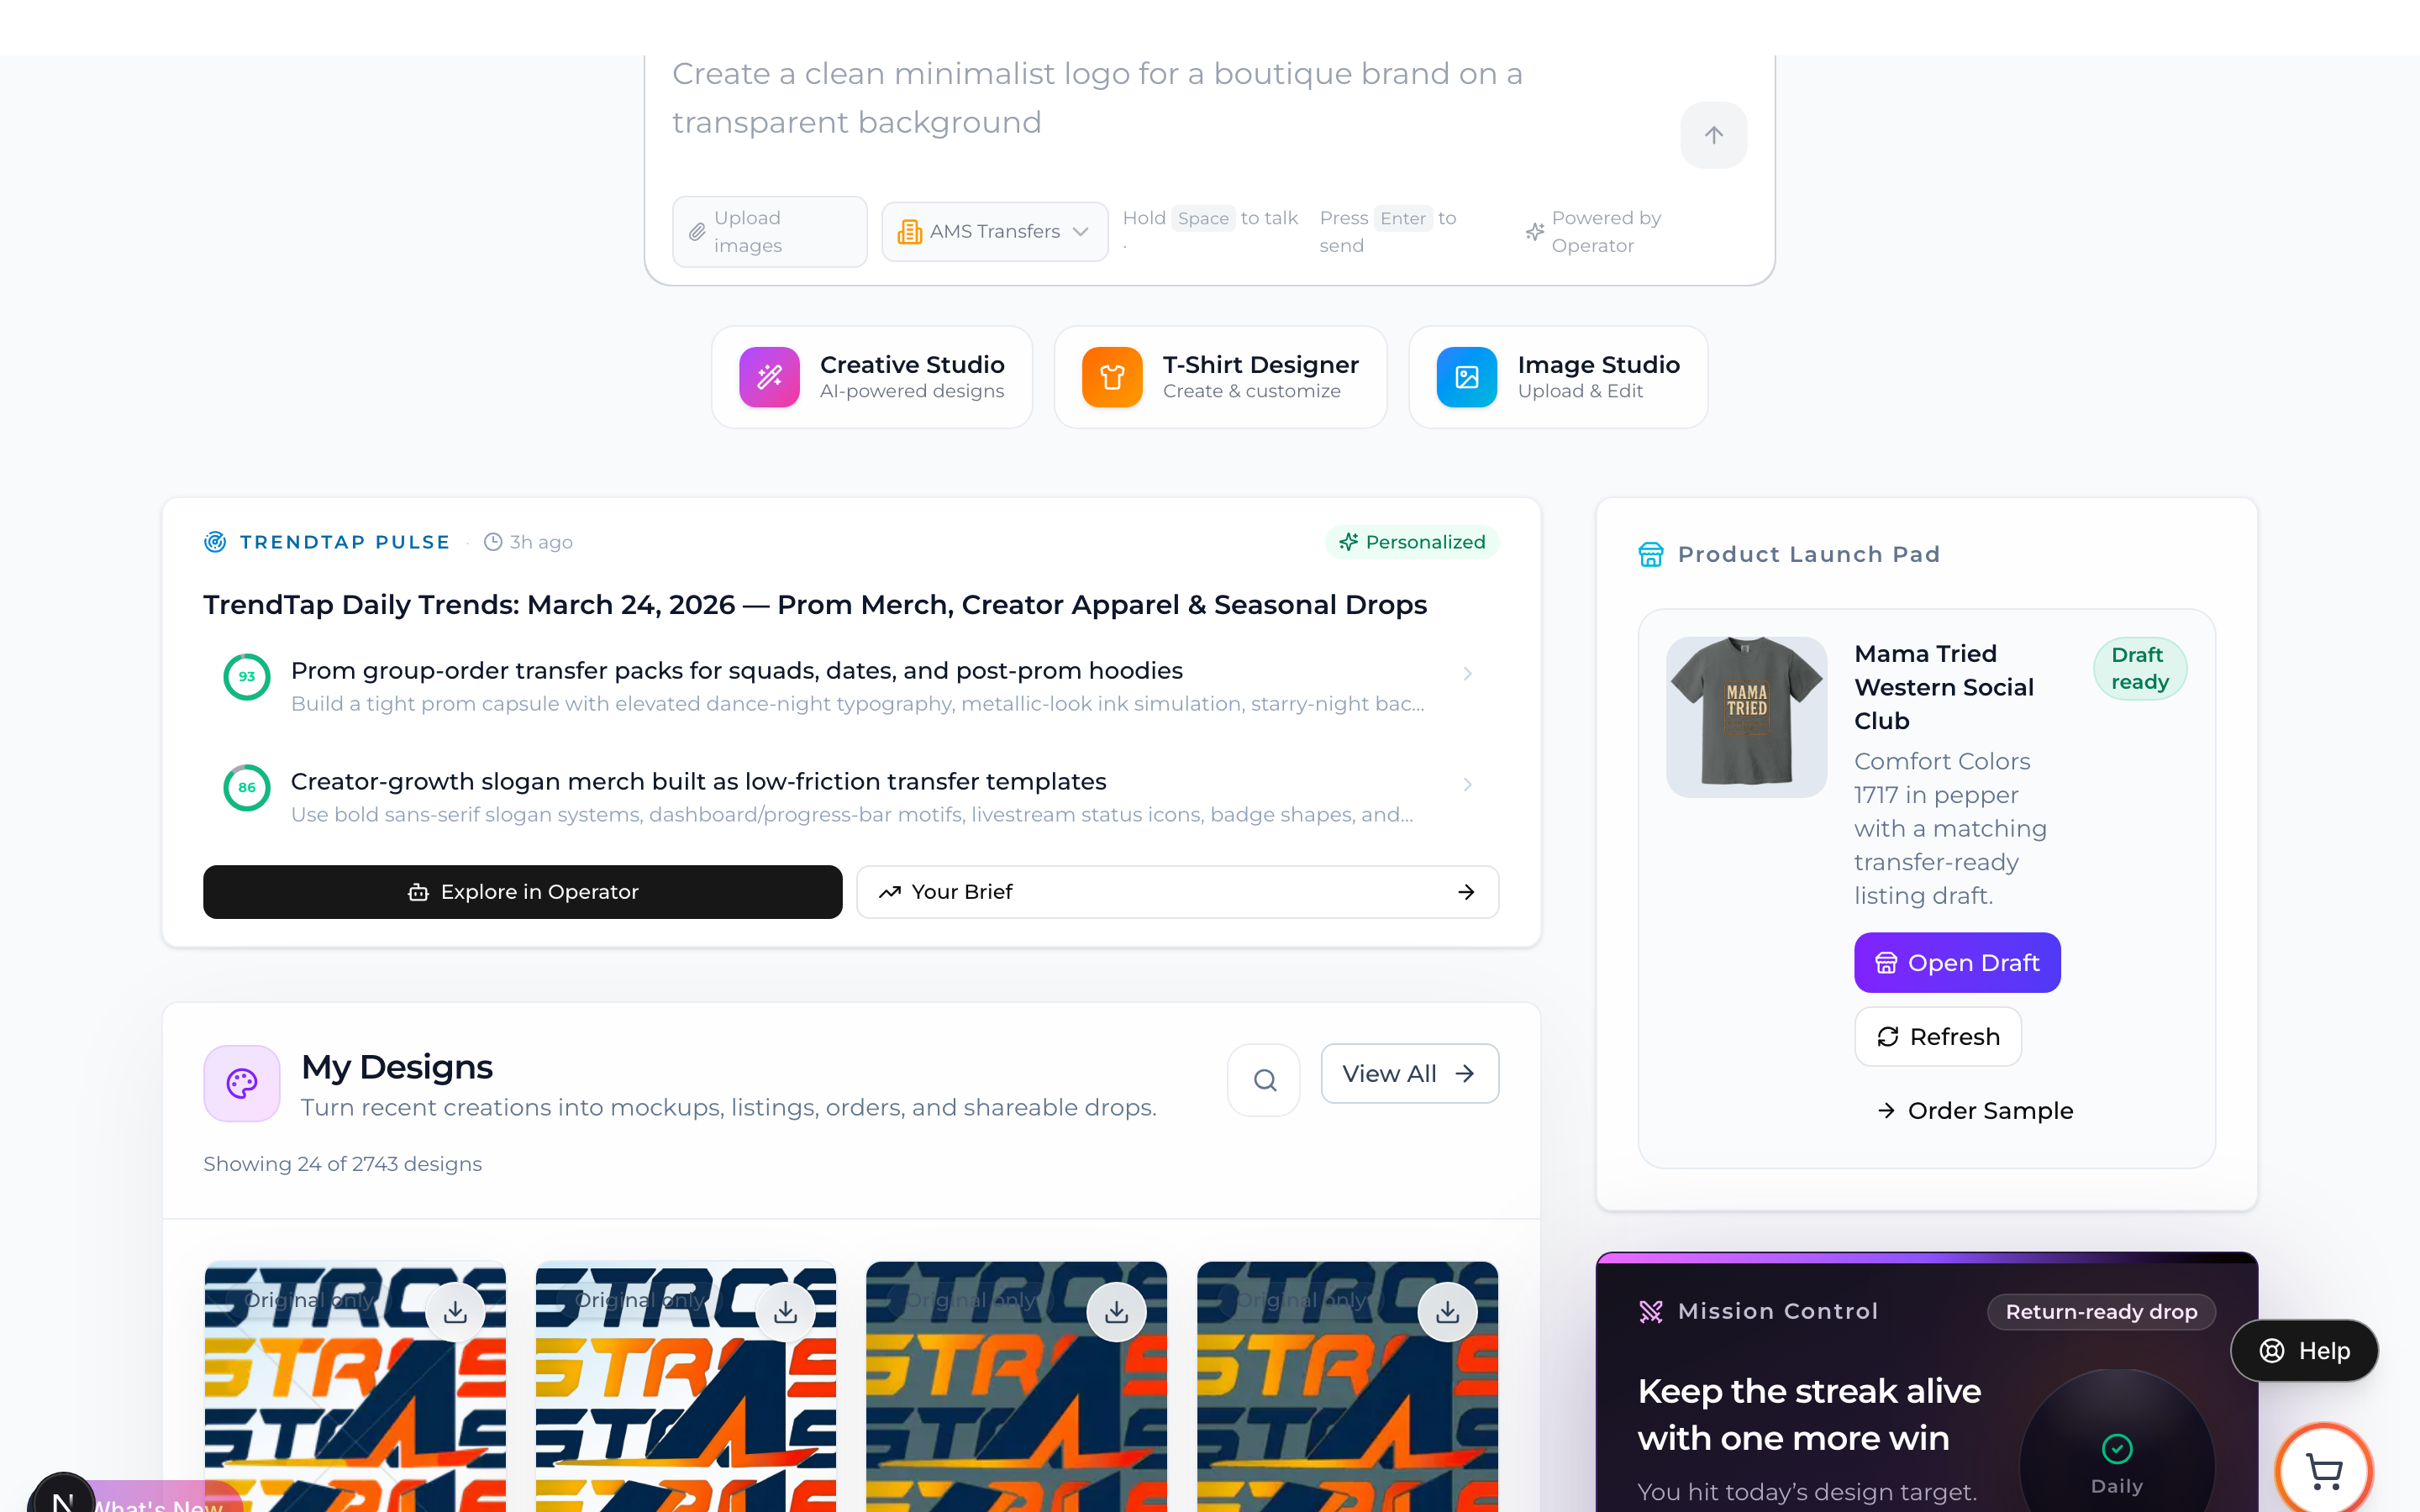
The TrendTap dashboard card highlights your latest trend brief. When a new report is available, a badge and banner draw your attention to it.
How the dashboard card adapts
The TrendTap dashboard card is designed to show you the most important thing at any moment:
- If you have an unread monthly report, the card features it with a "New" badge and "Monthly Trend Report" label.
- If no monthly is unread but a weekly is, the card features the weekly report.
- If no reports are unread, the card shows your latest personalized brief headline or global trend highlights.
- Report "chips" at the bottom show all recent reports with small labels (Month, Week, Day).
The dashboard card prioritizes the most important unread report. Click to jump straight to it.
Example: Your weekly roundup just dropped — here is how to use it
It is Monday morning. TrendTap aggregated last week's daily briefs into a weekly roundup overnight.
- You see a "New" badge on the TrendTap card on your dashboard. The label says "Weekly Roundup."
- You click the card and land on the Missions tab. A green banner says "This Week's Trend Roundup is ready."
- You click "Read Report" and switch to the Intelligence tab. The Weekly horizon is pre-selected.
- You scan the report. Three trend sections catch your eye.
- You click "Create Design" on the most promising one. Operator opens with the trend context ready.
- You read the remaining sections for strategic context, then return to the Missions tab to act on your personalized opportunities.